
Symposium on Visualization in High Performance Computing
|
FCFull Conference Pass (FC - All Days)
FC1Full Conference Pass (FC - 1-Day Only)
BCBasic Conference Pass
ExExhibits Only
ETElectronic Theater Ticket
RTReception Ticket
|
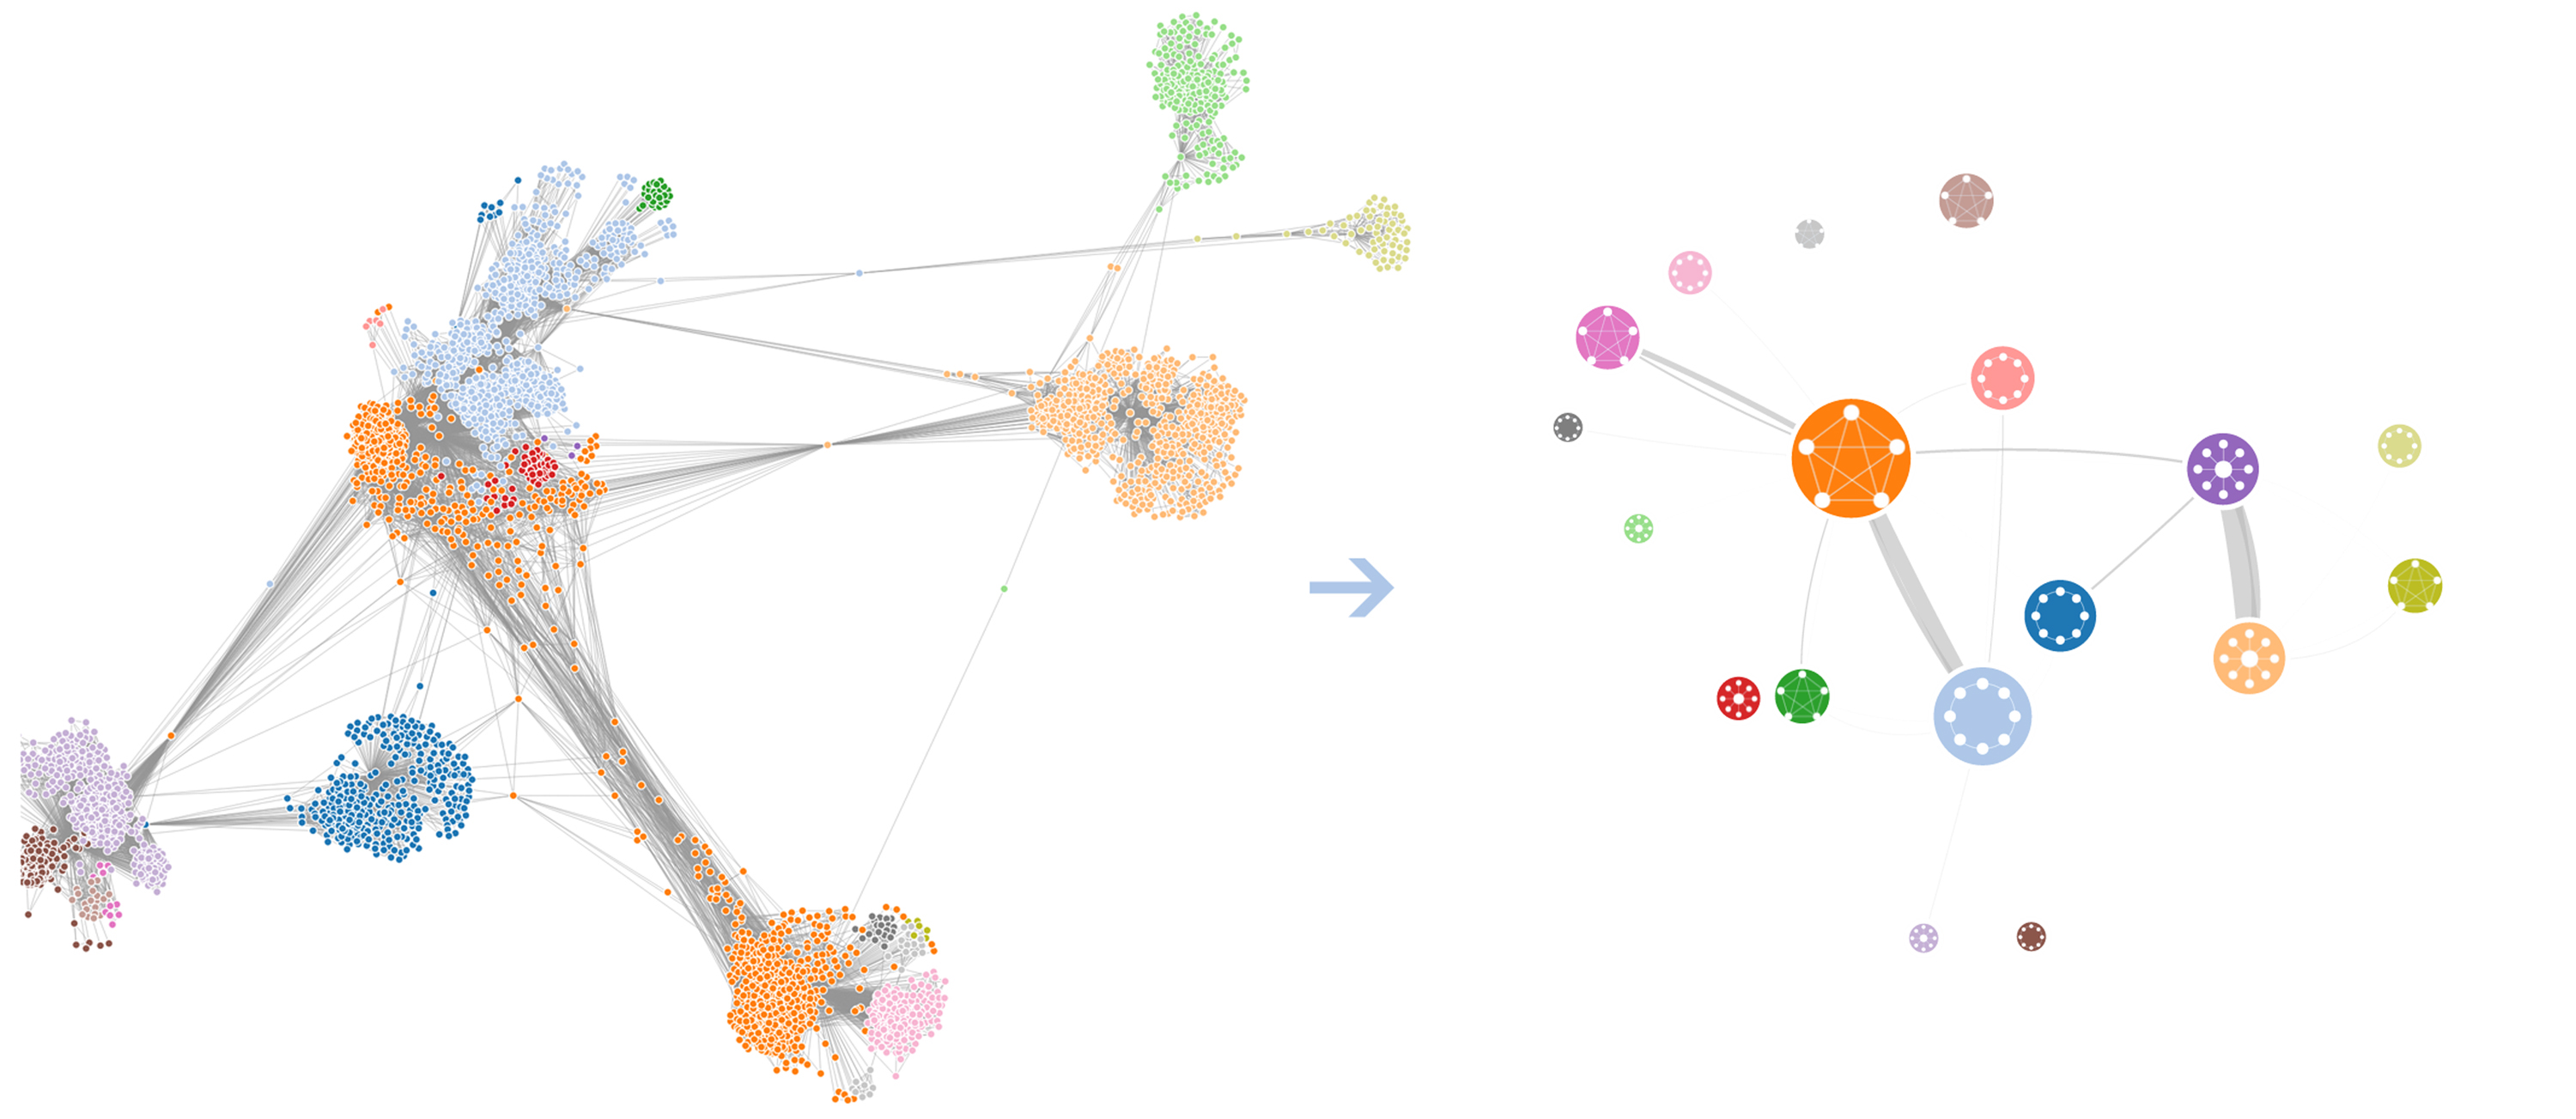
ModulGraph: Modularity-based Visualization of Massive Graphs
Large graph visualization has become a dominant problem in multiple big data analytics domains, including media analytics, social network dynamics, resource management in cloud computing environments, air travel, large networks. A practical approach to displaying massive graphs is by partitioning according to well defined domain-dependent attributes. However, graph visualization in the presence of incomplete information is an open challenge in many applications. In order to better visualize and understand patterns in large graphs, local pattern discovery becomes a critical step in deciding the structural components of graph visualization. In this paper, we present a modularity-based graph visualization method, termed as the ModulGraph. The ModulGraph is a hierarchical representation that treats a graph as a set of modules. The main objective of this work is to hierarchically detect graph patterns in order to visualize large graph data and adapt the interconnecting structures to potential interactions between local module streams. Our main contribution is a graph visualization method that can flexibly detect the local patterns or substructures, called modules, in large graphs. The second contribution is a modularity measure. This measures hierarchically the cohesion of the graph at various levels of details. We aggregate clusters of nodes and edges into several modules for the purpose of reducing the overlap on the display. Graph patterns of modules are processed by the ModulGraph system in order to avoid information loss while a sub-graph is represented as a single node. Our experiments show that this method can support large-scale graph visualization for visual media exploration and analysis.
Presenter(s)
Chenhui Li , The Hong Kong Polytechnic University
George Baciu , The Hong Kong Polytechnic University
Yunzhe Wang , The Hong Kong Polytechnic University